In most BI tools, the default layout for a document offering data insights is a dashboard – typically a grid like structure of widgets in rectangular format each representing a visualisation displaying some data. One can easily understand why this is the default layout – most of the content is visual, it is easy to read and follow, and for the user creating the dashboard, they can easily play around and manipulate the layout with simple drag and drop tools. Also for consumers of the content it is a very straightforward for digesting data content.
In a lot of cases the dashboard wins out. You can send it over email or share it as is, and it is certainly very good for just showing on a large TV screen, as well as on desktop screens. In certain cases, however, you might also want to share information and insights but not in a dashboard format. Think about sending regular reports to your customers, board, investors, or any other people you are communicating with outside your company. Perhaps they would like to get something they are able to print out or get a nicely rendered HTML email, and not need to see an attachment of a dashboard image. That is one of the reasons DataReportive allows you to structure your data documents in various formats. One format we are offering is creating an HTML email data report with visualisations powered directly from your database.
If you are familiar with tools such as Mailchimp or Sendgrid then creating HTML email reports from your databases should be very familiar, and even if you are not familiar with any of these tools creating an email should be fairly easy. Let’s go through it step by step.
Step 1. Selecting you email layout
From your homepage or email page create a new new email. You will be prompted to select from five layout types shown bellow.
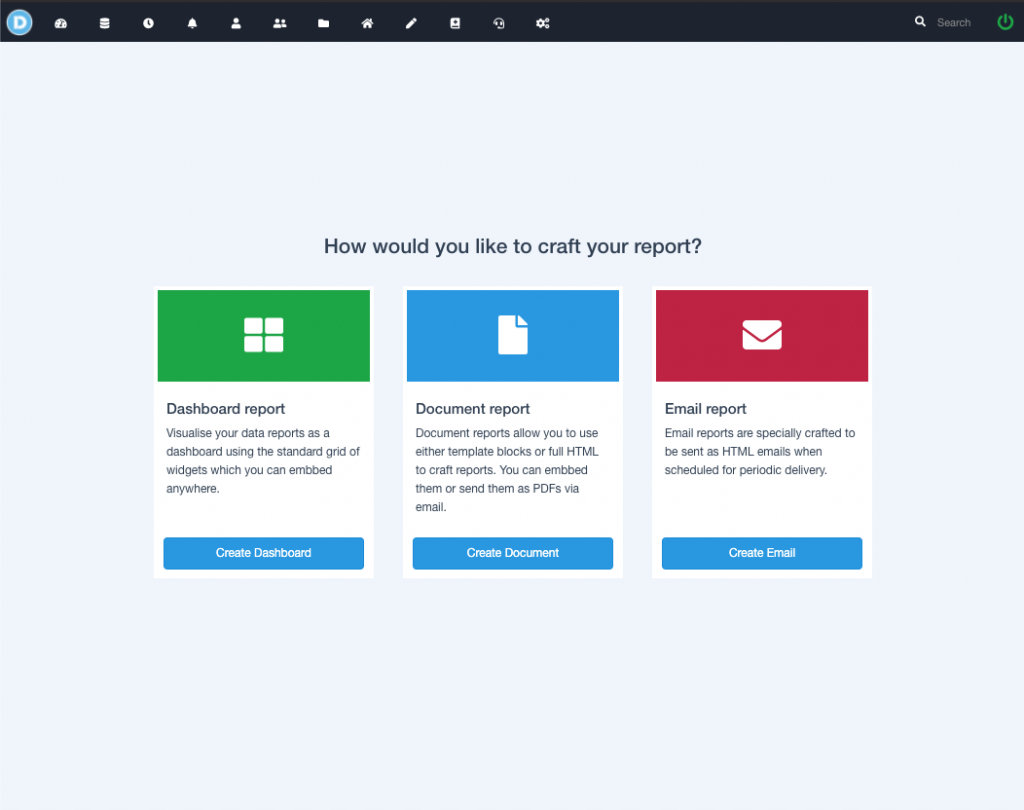
The layout of the email will determine mostly the layout of the header, footer and main element blocks.
Step 2. Adding content to your email
Once you’ve selected your layout you will be sent in edit mode for your newly created email report. As you will notice each layout already comes with a pre-defined header, footer, and a bunch of elements inside the content of the email. You can use these components and modify them using your own data and queries, or you can remove them and add whatever elements you want from the blocks on your side panel.
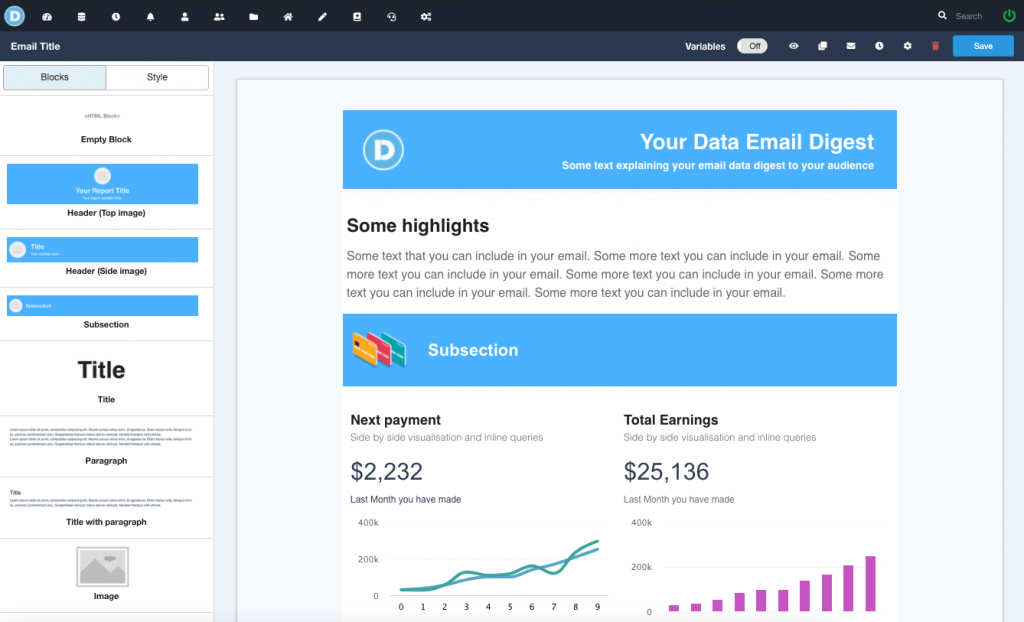
Similar to other email creation tools, you can select a block and customize its styling using the styling tools in the side panel. For more advance styling and changes you can always edit the HTML content of a block.
Step 3. Customising your content with variables
You might create the email with the intention of scheduling it so it goes off to different users or groups with the same layout, but with content specific to that user or group. The content can both relate to visualizations and textual content. You can always create a duplicate email and change the content that needs to be changed for a particular schedule. An easier way to achieve this however, is using variables.
To use variable first enable them from the top panel. Once you’ve enabled them you should see a panel right of your report where you can define variables. A variable is composed of a name and you can also set a default value. They can be used both in SQL queries and in the text content.
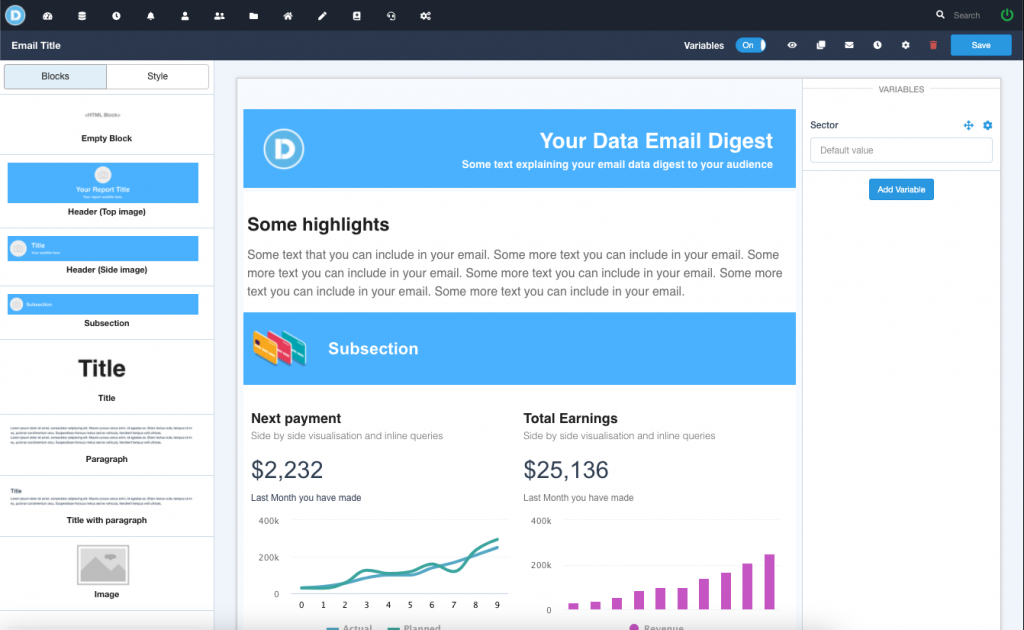
For example, let us say we want to send a slightly different sales report to every sales team, with the results that are relevant for their “Sector” (a sales sector can be for example a particular region or industry). Click the “Add Variable” to add a new variable. Name your variable “Sector”. By default the variable will render in a query or text of the email with whatever the value you put in the variable (Notice that while editing the variable will only render in queries, but not in text. When sending a report it will render in both.). You can add any prefixes or suffixes to the way the variable is rendered by changing the “Rendering” field in the variable options. For example if we put “Rendering” as “Sector: [[VALUE]]” and add the value for the variable “South” it will render as “Sector: South”.
While editing, you can put in a default variable by adding a value in the variable. The default variable will be used when sending scheduled reports if a variable is not defined. Note that while editing your email the variable will only be applied to queries and not any text in the email.
Step 4. Sending or scheduling your email report
Your email template is now ready to be scheduled to be sent to DataReportive users. With schedules you can send an email to various users or any groups you might have defined in a periodic manner, example daily, weekly or monthly.
When you are scheduling emails, in addition to filling in all the required information about when the email should be sent out, you will also be able to specify what variable values that particular schedule needs to be sent out with (see image below). For every combination of new variables you will need to create a new schedule.
Conclusion
We’ve given here a brief introduction on how to create HTML data emails with DataReportive. While we focused on the key functionalities, one thing we did did not cover is template customisation, which we plan to do in another post. With our HTML editor you can certainly customise you email to a high degree.