Categories
API DataReportive How to

Introducing the DataReportive API: Streamline Your Data Management and Report Scheduling

Are you tired of manually managing your users, groups, and schedules? Look no further! We are excited to announce the launch of the DataReportive API, a powerful tool that allows you to effortlessly retrieve, create, and edit Users, Groups, and Schedules. With the DataReportive API, you can streamline your data management process and take your productivity to the next level.

Simplified Authentication

Authentication is a breeze with the DataReportive API. Simply generate an API token for your admin user, and you’re ready to go. All requests to the API must include the Authorization header with the token, ensuring secure and authenticated communication. Say goodbye to complex authentication procedures and focus on what matters most: leveraging the API’s capabilities to enhance your workflow.

User Management Made Easy

Managing your users has never been easier. The DataReportive API provides comprehensive functionality for user operations. Retrieve all active users, get detailed information about specific users, create new users, and even update existing user details. Whether you need to add an admin, create a restricted user, or modify user attributes, the API has got you covered.

Efficient Group Management

Organizing your users into groups is a breeze with the DataReportive API. Retrieve all your groups effortlessly or fetch specific group details based on their unique identifier. Create new groups with custom names and descriptions, and even add or remove users from existing groups with a simple API call. Seamlessly manage your user groups and tailor them to your specific needs.

Streamlined Scheduling

Scheduling reports and tasks is a critical aspect of data management, and the DataReportive API simplifies this process. Get a comprehensive view of all your schedules or retrieve details about a specific schedule based on its ID. Creating new schedules is a breeze, allowing you to specify the report, schedule type, time, and delivery method. Whether you prefer one-time, daily, weekly, monthly, or quarterly schedules, the API offers the flexibility you need.

Effortless Report Management

While the API currently focuses on user, group, and schedule management, it also provides convenient functionalities for retrieving and deleting reports. Get metadata about your reports, including essential information such as report names, URLs, creation dates, and more. The API also allows you to delete reports as needed, providing you with the necessary control over your report data.

Enhanced Collaboration with Email Delivery

Collaboration is key in any data-driven environment, and the DataReportive API enables seamless communication through email delivery. Send reports to specific users or groups via email, ensuring that the right stakeholders receive the information they need. While Slack integration is not currently supported, the API’s email functionality empowers you to share insights and reports efficiently.

Simplified Integration and Support

Integrating the DataReportive API into your existing workflow is straightforward. All API requests must be made over HTTPS, ensuring the security of your data. Should you encounter any issues, have feedback, or require assistance, our dedicated support team is ready to assist you. We are committed to continuously improving the API and providing you with the best possible experience.


The DataReportive API opens up a world of possibilities for streamlining your data management processes. With its user-friendly functionality, you can easily retrieve, create, and edit users, groups, and schedules. Empower your team with efficient collaboration and optimized workflows, all while leveraging the power of the DataReportive API. Get started today and revolutionize your data management experience.

For more information and to explore the full capabilities of the DataReportive API, visit our documentation page.

Categories
Analytics Data DataReportive Email How to

Creating HTML Emails from your SQL database with DataReportive

In most BI tools, the default layout for a document offering data insights is a dashboard – typically a grid like structure of widgets in rectangular format each representing a visualisation displaying some data. One can easily understand why this is the default layout – most of the content is visual, it is easy to read and follow, and for the user creating the dashboard, they can easily play around and manipulate the layout with simple drag and drop tools. Also for consumers of the content it is a very straightforward for digesting data content.

In a lot of cases the dashboard wins out. You can send it over email or share it as is, and it is certainly very good for just showing on a large TV screen, as well as on desktop screens. In certain cases, however, you might also want to share information and insights but not in a dashboard format. Think about sending regular reports to your customers, board, investors, or any other people you are communicating with outside your company. Perhaps they would like to get something they are able to print out or get a nicely rendered HTML email, and not need to see an attachment of a dashboard image. That is one of the reasons DataReportive allows you to structure your data documents in various formats. One format we are offering is creating an HTML email data report with visualisations powered directly from your database.

If you are familiar with tools such as Mailchimp or Sendgrid then creating HTML email reports from your databases should be very familiar, and even if you are not familiar with any of these tools creating an email should be fairly easy. Let’s go through it step by step.

Step 1. Selecting you email layout

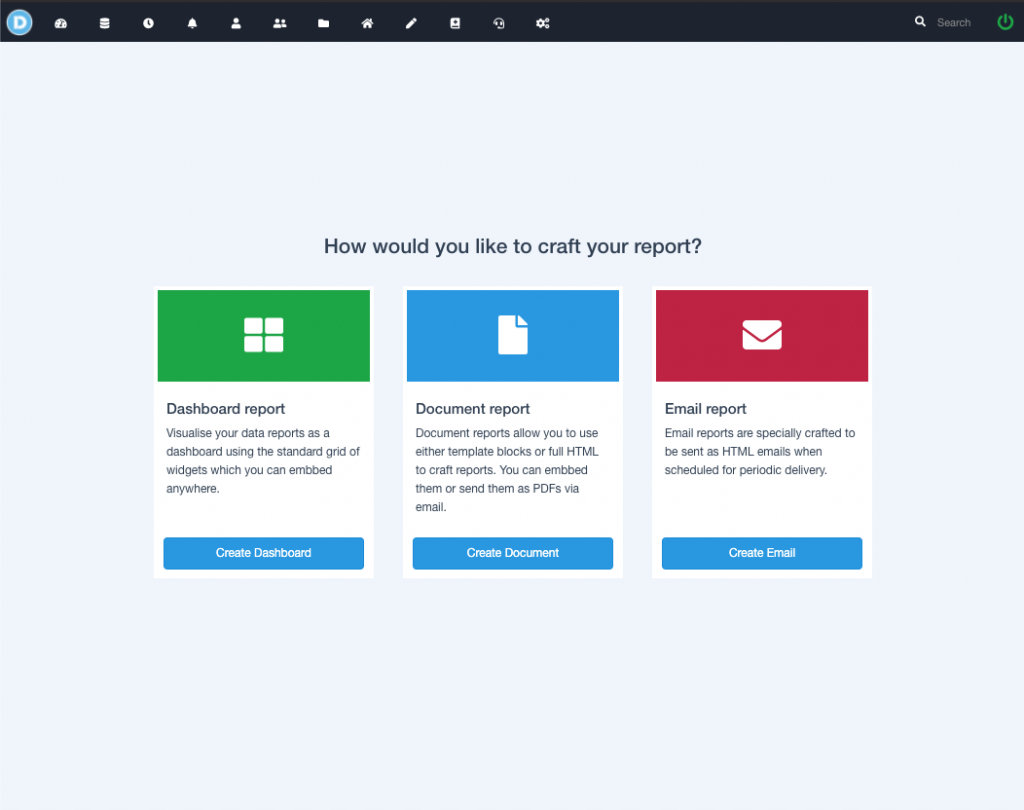
From your homepage or email page create a new new email. You will be prompted to select from five layout types shown bellow.

Selecting an email layout in DataReportive.

The layout of the email will determine mostly the layout of the header, footer and main element blocks.

Step 2. Adding content to your email

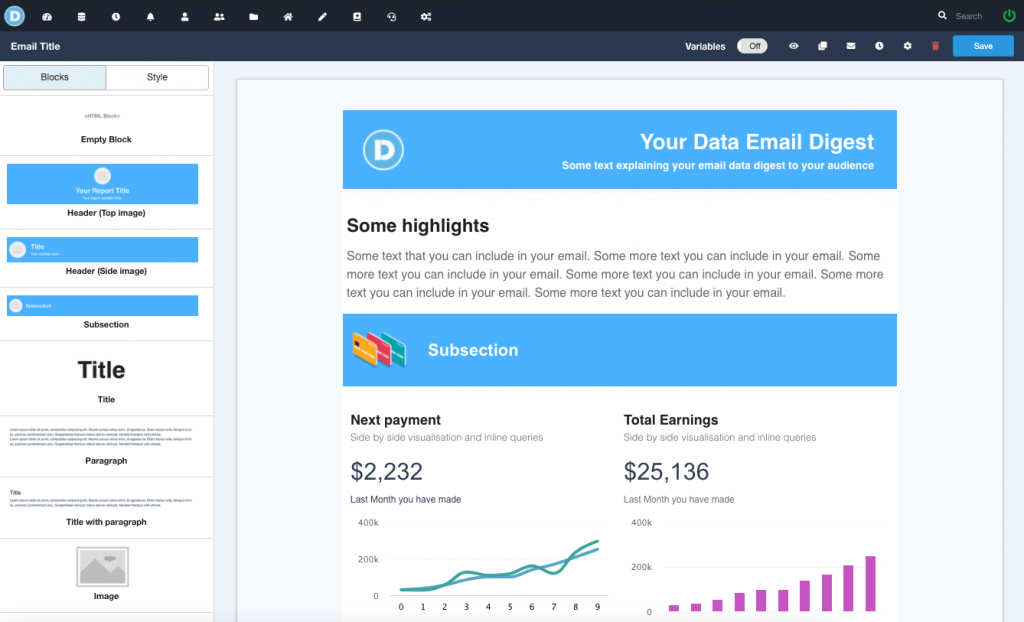
Once you’ve selected your layout you will be sent in edit mode for your newly created email report. As you will notice each layout already comes with a pre-defined header, footer, and a bunch of elements inside the content of the email. You can use these components and modify them using your own data and queries, or you can remove them and add whatever elements you want from the blocks on your side panel.

Similar to other email creation tools, you can select a block and customize its styling using the styling tools in the side panel. For more advance styling and changes you can always edit the HTML content of a block.

Step 3. Customising your content with variables

You might create the email with the intention of scheduling it so it goes off to different users or groups with the same layout, but with content specific to that user or group. The content can both relate to visualizations and textual content. You can always create a duplicate email and change the content that needs to be changed for a particular schedule. An easier way to achieve this however, is using variables.

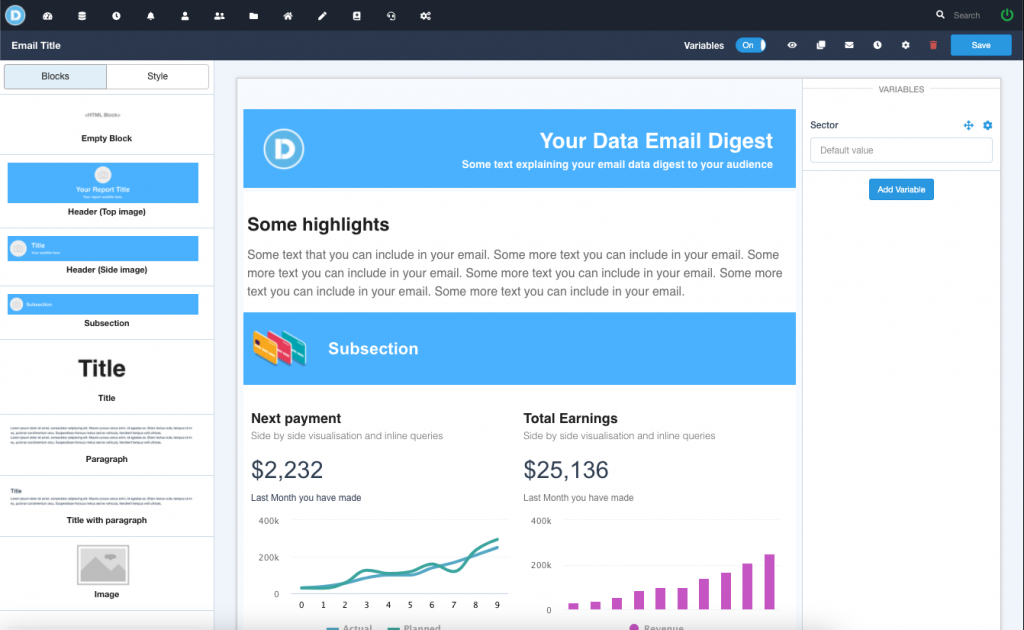
To use variable first enable them from the top panel. Once you’ve enabled them you should see a panel right of your report where you can define variables. A variable is composed of a name and you can also set a default value. They can be used both in SQL queries and in the text content.

For example, let us say we want to send a slightly different sales report to every sales team, with the results that are relevant for their “Sector” (a sales sector can be for example a particular region or industry). Click the “Add Variable” to add a new variable. Name your variable “Sector”. By default the variable will render in a query or text of the email with whatever the value you put in the variable (Notice that while editing the variable will only render in queries, but not in text. When sending a report it will render in both.). You can add any prefixes or suffixes to the way the variable is rendered by changing the “Rendering” field in the variable options. For example if we put “Rendering” as “Sector: [[VALUE]]” and add the value for the variable “South” it will render as “Sector: South”.

While editing, you can put in a default variable by adding a value in the variable. The default variable will be used when sending scheduled reports if a variable is not defined. Note that while editing your email the variable will only be applied to queries and not any text in the email.

Step 4. Sending or scheduling your email report

Your email template is now ready to be scheduled to be sent to DataReportive users. With schedules you can send an email to various users or any groups you might have defined in a periodic manner, example daily, weekly or monthly.

When you are scheduling emails, in addition to filling in all the required information about when the email should be sent out, you will also be able to specify what variable values that particular schedule needs to be sent out with (see image below). For every combination of new variables you will need to create a new schedule.

Conclusion

We’ve given here a brief introduction on how to create HTML data emails with DataReportive. While we focused on the key functionalities, one thing we did did not cover is template customisation, which we plan to do in another post. With our HTML editor you can certainly customise you email to a high degree.